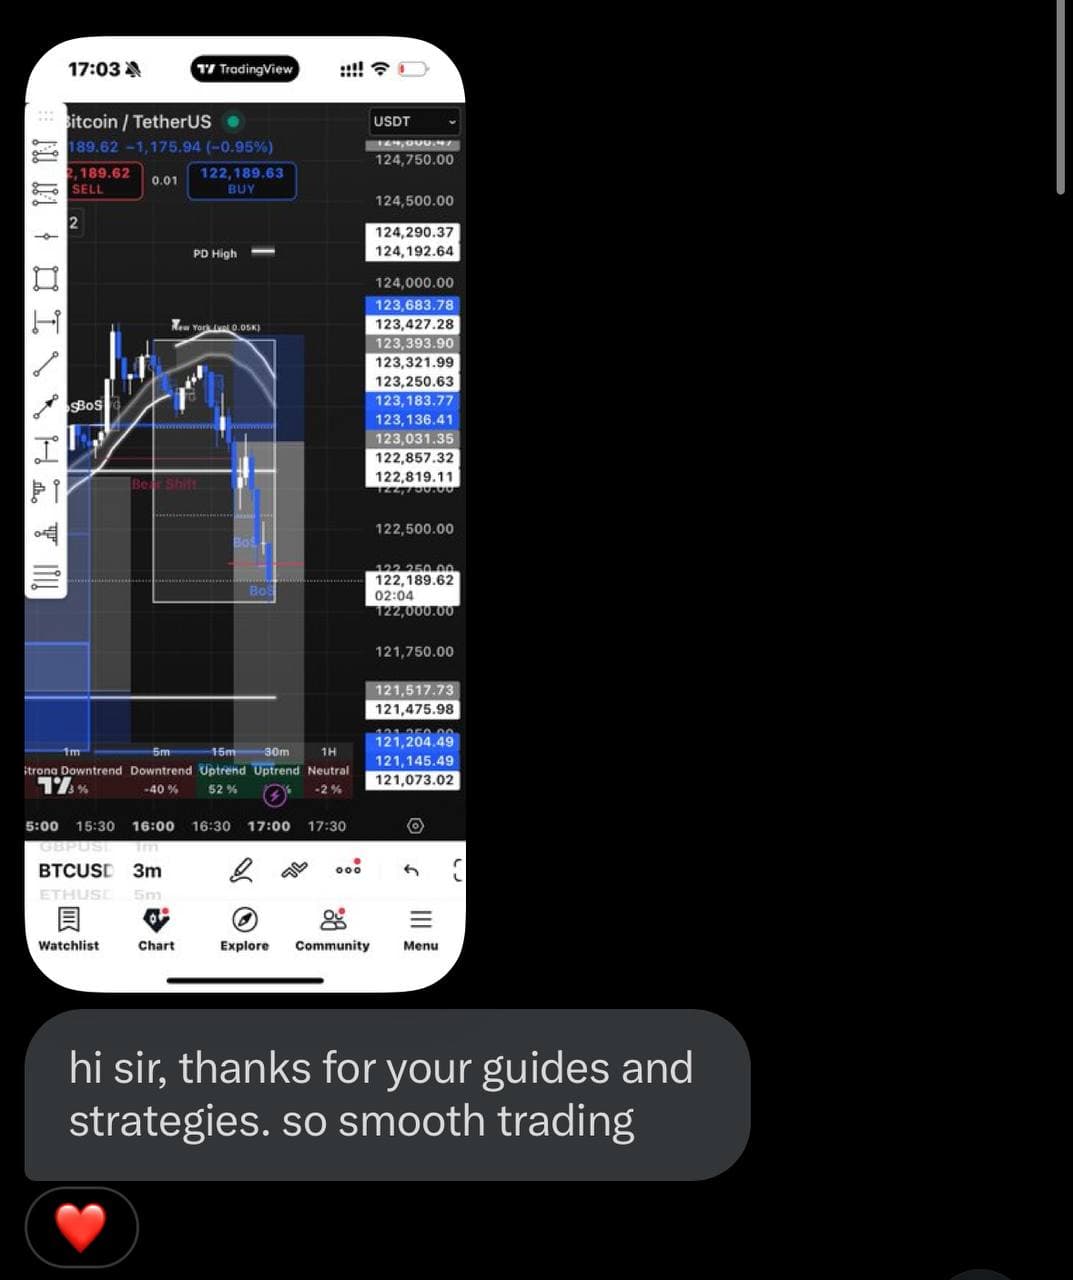
Bull & Bear Shifts (CHoCH)
Markets don’t just flip randomly. Our Bull & Bear Shift signals cut through the noise, confirming when structure changes — so you spot reversals instantly.

From reactive to systematic. AI-powered ICT frameworks that sharpen how you read, plan & execute across Forex, Stocks, Futures, Metals, Indices, Alts & Memes.

From structure shifts to liquidity heatmaps, our tools cut through noise and show you where institutions are really trading. No more guessing — trade with precision and confidence.
Trade with smart-money tools—not lagging indicators. We fuse liquidity maps, CHoCH/BOS, SMT divergence, FVGs, and volumized order blocks into actionable signals you can trust.
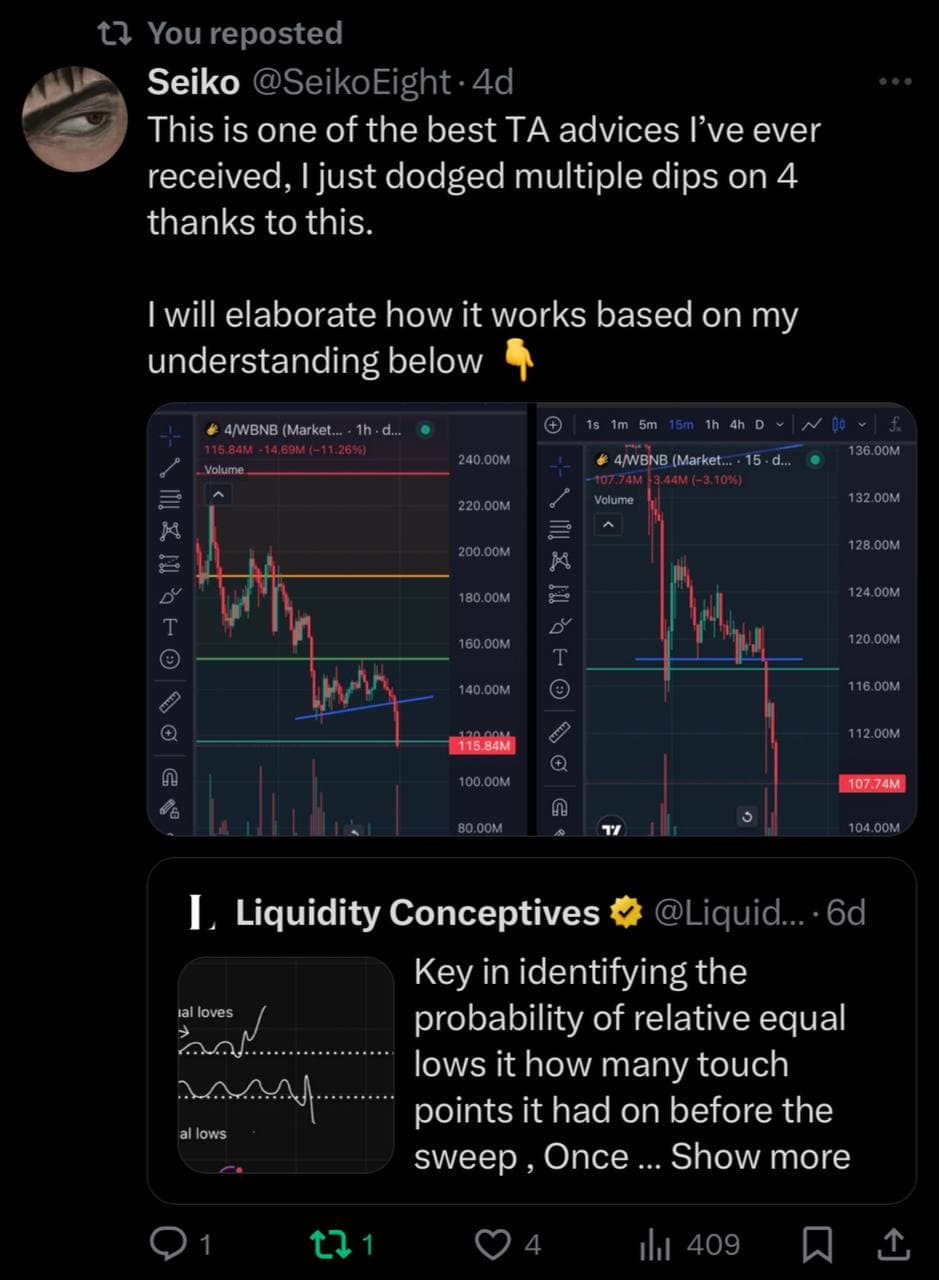
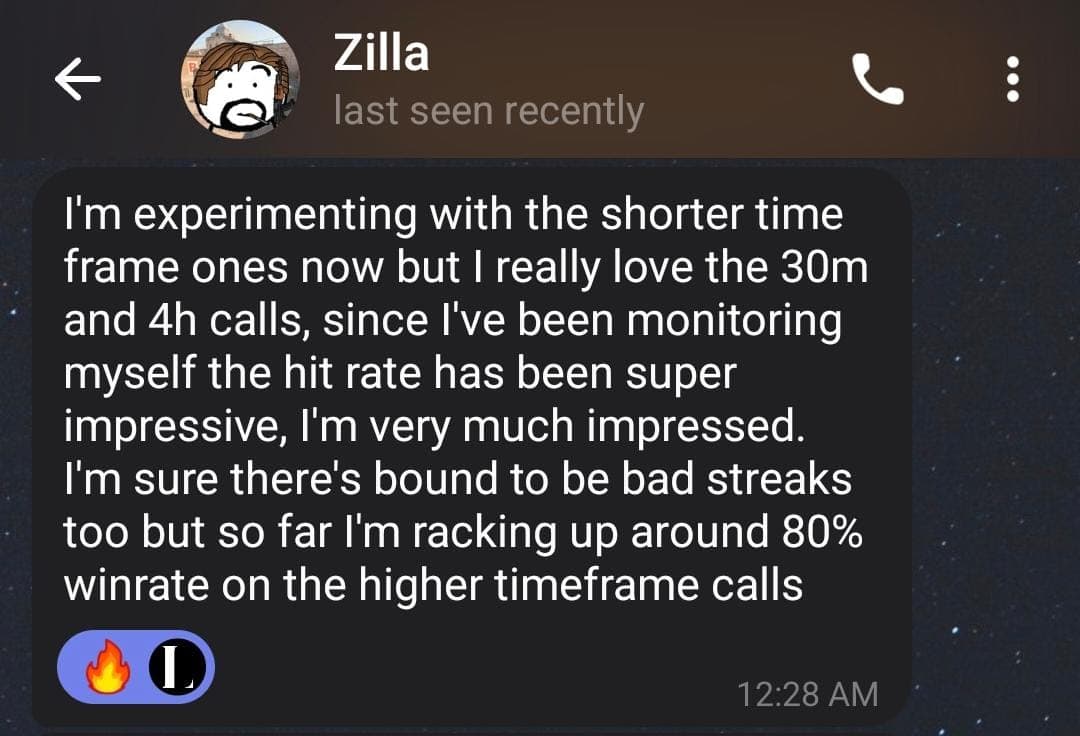
Thousands of traders worldwide already rely on Liquidity Conceptives to trade with more clarity and confidence.


Get full access to the complete Pro experience — every indicator, every feature, and every market included.
Warning: This tool can deliver strong wins — but don't overtrade. Stay disciplined. 1–2 high-quality trades per day max.
Liquidity Zone Sessions
Reveals where most liquidity lies in each trading session, helping you avoid false moves and focus on high-probability sweeps.
Order Blocks
Automatically marks order blocks so you can see where big players enter the market — no guessing required.
Fair Value Gaps (FVGs)
Identifies imbalances in price where the market is likely to return, giving you clear entry zones.
Change of Market Structure (ChoCH / BOS)
Highlights shifts in market structure so you can easily spot reversals and trend continuations.
Trend Data
Tells you whether the market is in a strong or weak uptrend or downtrend — so you always trade with the right bias.
SMT Divergence
Automatically detects Smart Money Divergence, showing you hidden shifts between correlated assets for advanced precision.
Previous Day High / Low Levels
Automatically plots the prior day's high and low to help you spot liquidity sweeps, key reaction zones, and intraday reversals.
Supply & Demand Zones
Automatically identifies supply and demand zones based on confirmed swing structure, helping you spot high-probability reaction areas.
Buy / Sell Side Liquidity
Plots buy side and sell side liquidity levels from external range highs and lows to highlight likely sweep targets.
Daily Bias Indicator
Displays a clear bullish, bearish, or neutral daily bias using only closed daily candles for higher timeframe context.
Reversal Zone Indicator
Highlights momentum exhaustion and potential reversal zones using overbought and oversold conditions.
Quick answers about access, platforms, alerts, pricing, and data.